Creating a function
In R, most of people used build-in functions which are very useful
for all basics statistical analyses. When you need to do more complex
statistics you can use packages.
There is almost every current statistical functions and more in the
CRAN repository. However, time to time you will need to build your own function. Usually, when I build a function is because for loop will not be efficient and that I need to put different parameters that I can change.
I will take here an easy example that I have previously done for my work.
I wanted to build a short function to draw maps and save them if I needed to.
The data
There is two tables in this example. The first one data_plot_scale.txt is data of forest plots location, with different information such as the trees status, the (living or dead), mark (NA for no marks, DBH for trees with diameter information), dead for dead trees position only and mortality for mortality pattern), the stands names (Stand_ID.m), lng for longitude and lat for latitude coordinates and a result like state 1 to 3 in the column pattern_state. The second table is very similar but at the stand scale data_stand_scale.txt.
Those data represent results of spatial patterns (aggregation, repulsion or random) in forest at the plot and stand scales. Because several plots, which could have different patterns states, are in one stands, the stands patterns could be different from the plots scale. Also, because I needed a tree threshold to compute spatial patterns, there is few plots and stands that cannot be analyse for the dead status (stands #4, for example).
library(data.table)
data_plot_pat <- fread("data_plot_scale.txt") #read the data
data_stand_pat <- fread("data_stand_scale.txt")

data_plot_pat
data.table 1.10.0
  The fastest way to learn (by data.table authors): https://www.datacamp.com/courses/data-analysis-the-data-table-way
  Documentation: ?data.table, example(data.table) and browseVignettes("data.table")
  Release notes, videos and slides: http://r-datatable.com
      Status mark Stand_ID.m      lng      lat pattern_state
   1:   dead dead         17 20.11335 49.18592        state2
   2:   dead dead         17 20.11335 49.18592        state2
   3:   dead dead         17 20.11335 49.18592        state2
   4:   dead dead         17 20.11794 49.18627        state2
   5:   dead dead         17 20.11798 49.18874        state2
  ---
1544: living   NA         33       NA       NA        state2
1545: living   NA         33       NA       NA        state2
1546: living   NA         33       NA       NA        state2
1547: living   NA         33       NA       NA        state1
1548: living   NA         33       NA       NA        state1
When doing functions you will need first to create arguments (vector) that will be used in the function. In this example, I will use status as a proxy for Status (note the S uppercase difference), markk for selecting mark, and then just 2 others FALSE or TRUE vector is I want to have the graphics outputs with the stands and if I want to save same or not in the current directory.
The function
map_draw_blog <- function (status, markk, with.stand, save, ...) { #usually put ... to path others arguments
    library(ggmap)#use library instead of require to stop the function if you did not have the library
    library(ggplot2)
    library(data.table)
     #plot prep data
    setkey(data_plot_pat, Status, mark)
    #below you need to put %in% for the mark to take into account the mark == NA
    for_mapping_plot  <- data_plot_pat[Status == status & mark %in% markk] [, .( Stand_ID.m,lng, lat, pattern_state)]

    #remove duplicated rows
    for_mapping_plot <- for_mapping_plot [!duplicated(for_mapping_plot )]

     #Stand prep data
    small_data_inf <- data_plot_pat[, .( Stand_ID.m, lng, lat)]

    #compute the mean of lng and lat by Stand_ID.m with removing NA value  only to remove lat and lng NA value
    to_map <-small_data_inf[, lapply(.SD, mean, na.rm = T), by = Stand_ID.m]

    pattern_to_put_map <- data_stand_pat[Status == status & mark %in% markk] [, .(Stand_ID.m, pattern_state)]

    for_mapping <- merge(to_map, pattern_to_put_map, by = "Stand_ID.m", all = T)#all = TRUE to keep all the no match from the 2 tables
    #keep only data with complete cases (remove row with NA values)
    for_mapping <- for_mapping[complete.cases(for_mapping)]

    #create the map background using Google satellite data
    google_map <- get_map(location = c(14,46,26,49),  maptype = "satellite", source = "google", zoom = 6)
    if(with.stand == TRUE) {
        if(save == TRUE) {
            ggmap(google_map) +  geom_point(data = for_mapping, aes(
        lng,  lat, color = factor(pattern_state)),
	size = 10, alpha =.80)+  geom_point(data = for_mapping_plot,
        aes( lng,  lat, color = factor(pattern_state)), size = 2)+
	geom_label(data = for_mapping, aes(lng,  lat + .2, label =
        Stand_ID.m,color = factor(pattern_state)), size = 4) +
	ggsave(paste0(status, " ", markk, " map with stand and plots patterns.jpg"))
        } else { #end if save = TRUE
            ggmap(google_map) +  geom_point(data = for_mapping, aes(
        lng,  lat, color = factor(pattern_state)),
	size = 10, alpha =.80)+  geom_point(data = for_mapping_plot,
        aes( lng,  lat, color = factor(pattern_state)), size = 2) +
	geom_label(data = for_mapping, aes(lng,  lat + .2, label = Stand_ID.m,color = factor(pattern_state)), size = 4)
        }
    } else { #end if with.stand = TRUE
        if(save == TRUE) {
            ggmap(google_map) +  geom_point(data = for_mapping_plot,
        aes( lng,  lat, color = factor(pattern_state)), size = 2)+
	geom_label(data = for_mapping_plot, aes(lng,  lat + .2, label
        = Stand_ID.m,color = factor(pattern_state)), size = 4) +
	ggsave(paste0(status, " ", markk, " map without stand and plots patterns.jpg"))
        } else {
            ggmap(google_map) + geom_point(data = for_mapping_plot, aes( lng,  lat, color = factor(pattern_state)), size = 2)
        }
    }
}
Here you can use the freshly build function map_draw that we just
created. The status can be "living" or "dead".
For the markk note that you need to put NA without any quote. Also,
you can put just F for FALSE or write FALSE, and the same for TRUE,
the result will be the same.
map_draw_blog(status = "living", markk = NA, with.stand = T, save = F)
map_draw_blog(status = "living", markk = "DBH", with.stand = FALSE, save = T)
map_draw_blog(status = "dead", markk = "dead", with.stand = T, save = TRUE)
map_draw_blog(status = "dead", markk = "mortality", with.stand = T, save = T)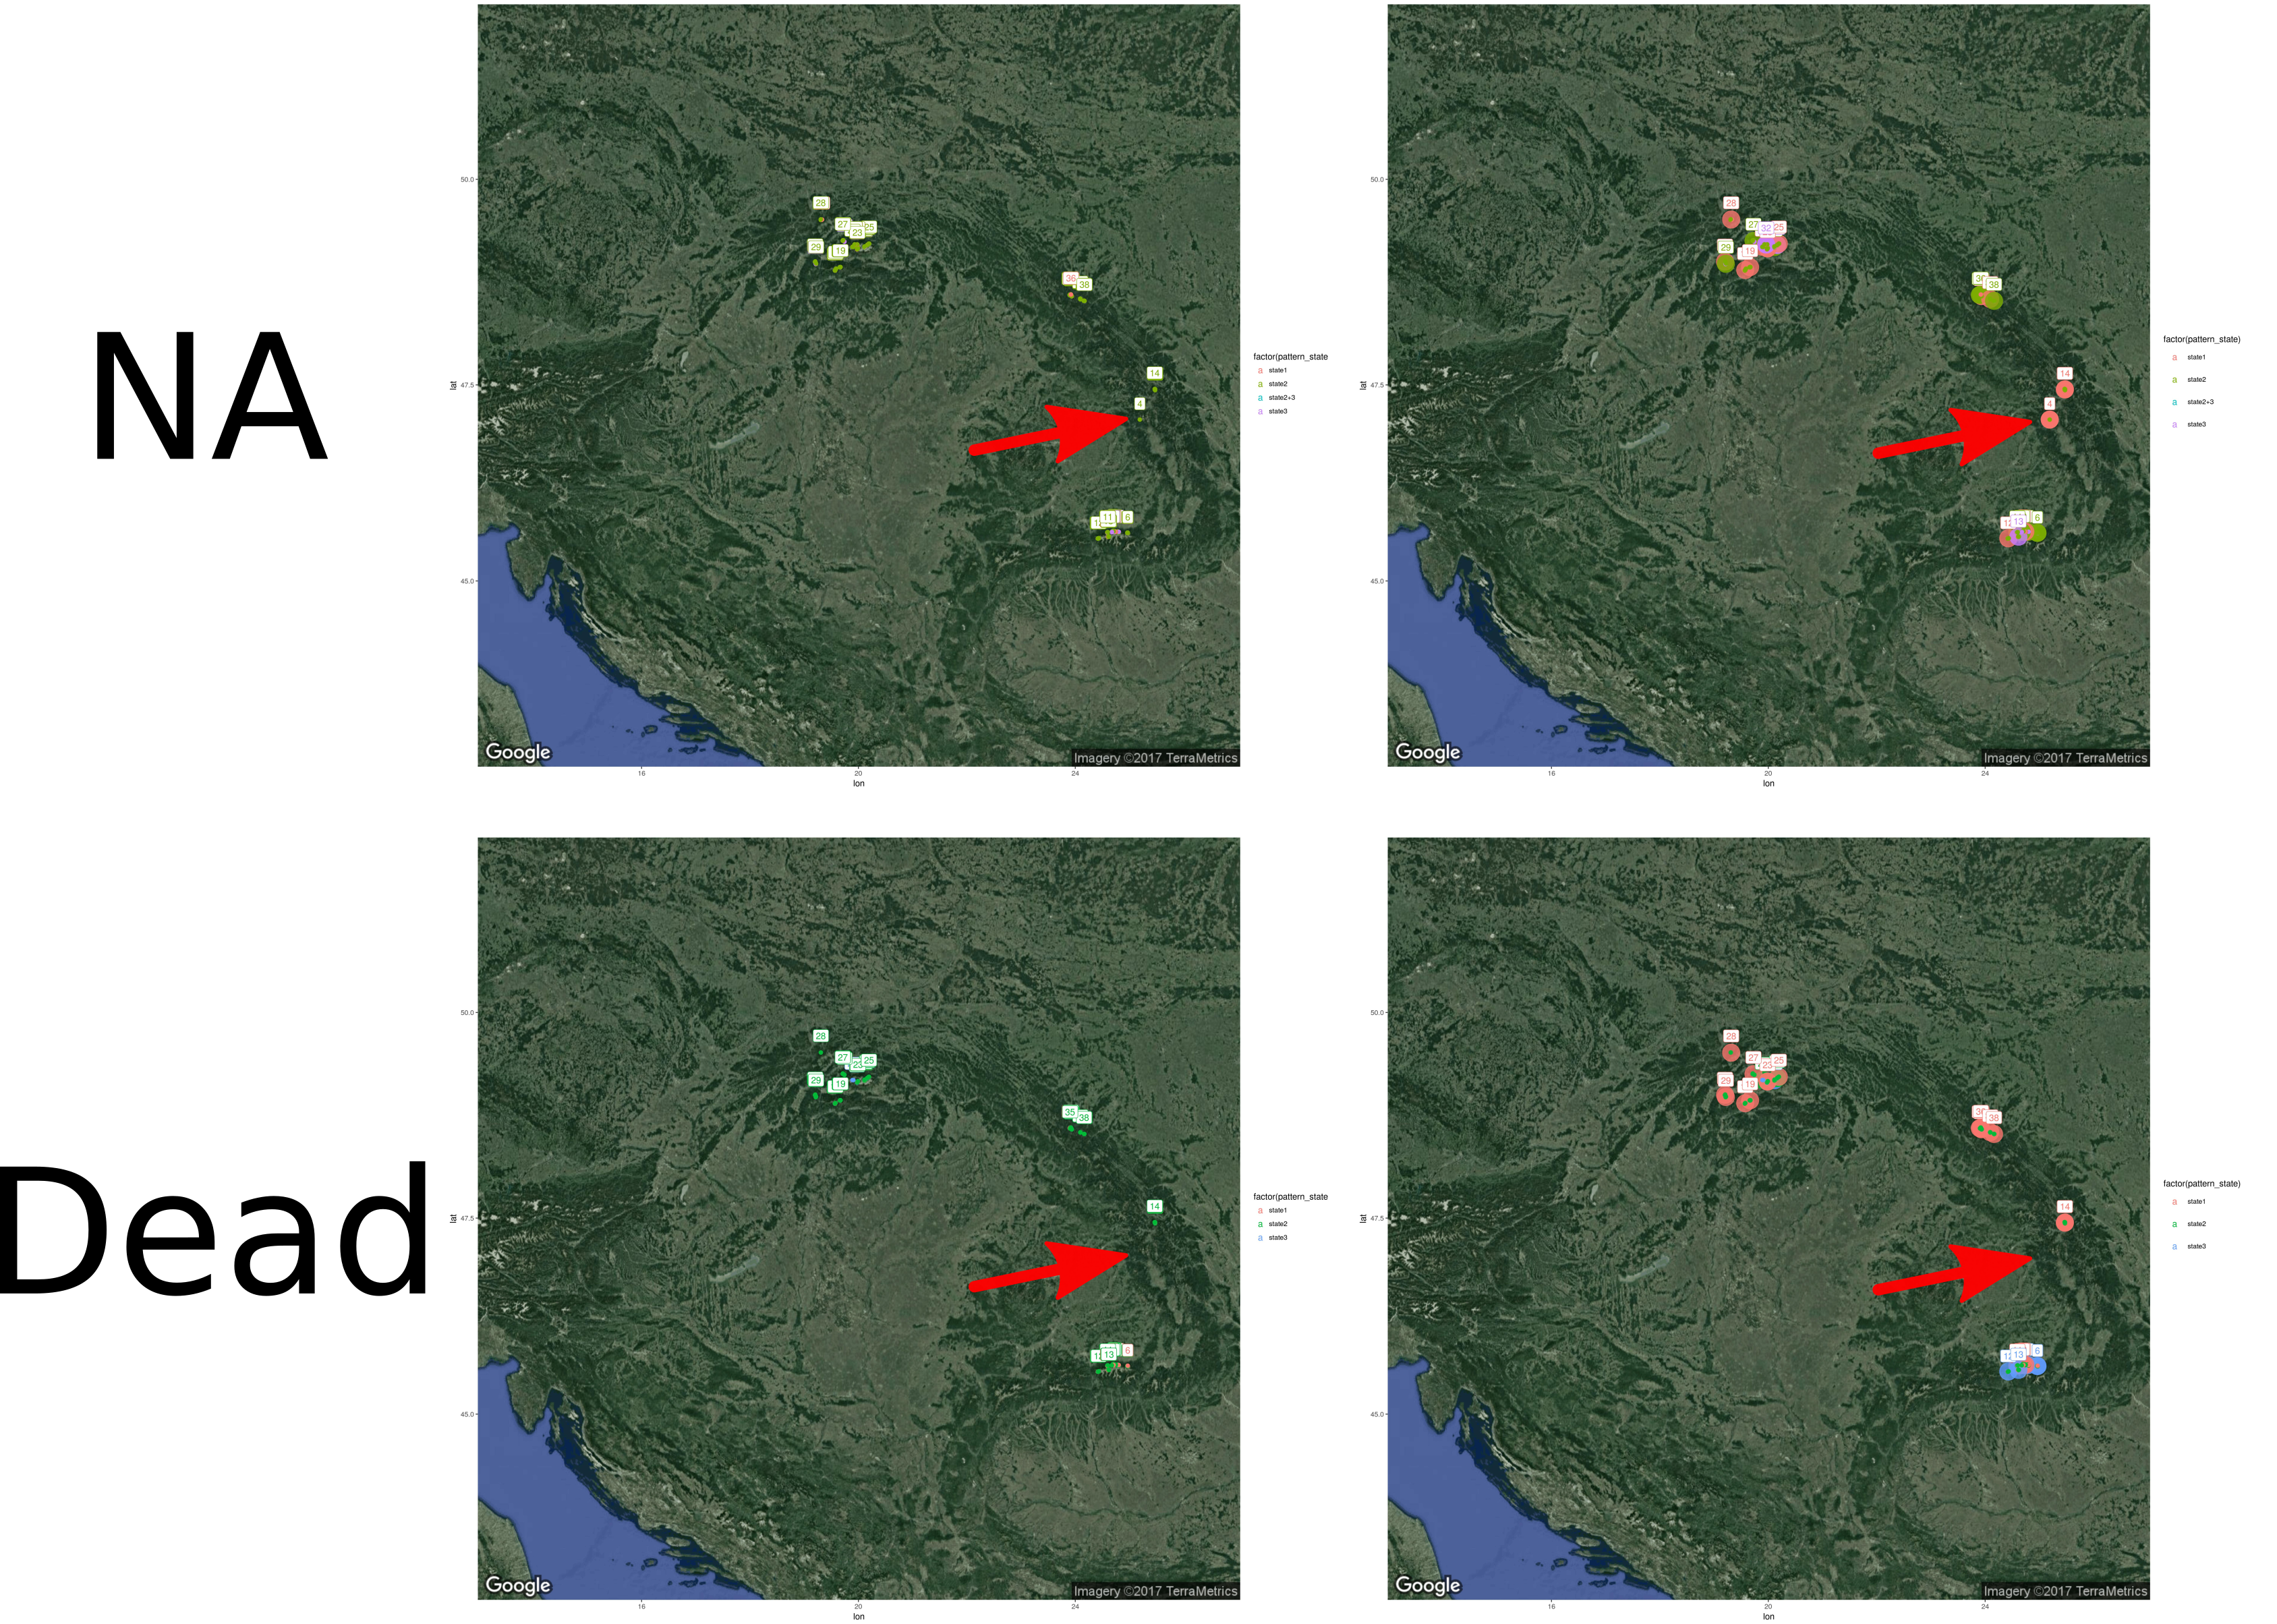
I edit the graph using Inkscape to put a red arrow on the plots/stands that appear only for living status.