parallelisation computing
I already show you how to do for loop and nested for loop. When you
want to do parallelisation computing, you simply replace the for
command by the foreach command and %dopart%.
Depending if you are on Windows, MacOS or Linux, you will need to do the parallelisation differently. I personally do it on Windows and Linux.
Within a foreach loop, you will need to declare the loop variable
as you usually do in the for command, but also to declare the
package that you are going to use within the foreach loop using the
command .packages. You also need to set the .multicombine to TRUE
is you want combine all the parallelism computing within a single
output and finally you can use the .final argument to customise the
output (list of list, etc.).
Keep in mind that the parallelisation will be processing using the
number of core that you declare in the foreach session and those
results will be sort in the same
First we create 100 random point patterns with 2
different marks "A" and "B" :
#creating random spatial data with 2 marks
library(spatstat)

plot_NA_list <- NULL
for (i in 1:100) {
    # some arbitrary coordinates in [0,1]
    x <- runif(70)
    y <- runif(70)

    # marks
    m <- as.factor(sample(c("A","B"), 70, replace=TRUE))
    #creat ppp with marks
    X <- ppp(x, y, c(0,1), c(0,1), marks=m)
    X <- list(X)
    names(X) <- i #set the names for each ppp
    plot_NA_list <- append(plot_NA_list,X)#add the ppp to the list
}

plot_NA_list[1:2]
$`1` Marked planar point pattern: 70 points Multitype, with levels = A, B window: rectangle = [0, 1] x [0, 1] units $`2` Marked planar point pattern: 70 points Multitype, with levels = A, B window: rectangle = [0, 1] x [0, 1] units
Before going more further, you will need to install the following package in R: doMC (or doSNOW if you use Windows), spptest and marksummary package which are 2 greats packages when you do spatial point pattern (you can found them at https://github.com/myllym/GET for the spptest package and at https://github.com/myllym/marksummary for the mark summary package).
The following code will compute the "Lest" function overall 30
spatial pattern simulation (usually this is 2499 simulation) from the random data set. The "Lest" function will
basically see if the mark "A" from the spatial pattern is randomly
distributed regarding the mark "B" across the spatial pattern (this is
define in the simulate argument in the envelope function. Then, we
compute a rank envelope test (see here for more details). Thus, if the
result from the rank envelope test is significant and when we plot it
the observed data are above the envelope, then "A" and "B" have a
positive correlation relationship (i.e. there are attracted one to another), if this is below the envelope threshold,
then "A" and "B" have a negative correlation relationship (i.e. there
are segregate one to another).
Finally, we put the result of the rank envelope test into a list with also the random labelling residual data.
library(doMC) #only for Linux,used library(doSNOW) for Windows and uncomment the above lines
#      clusterN <-  detectCores()-1  ### choose number of nodes to add to cluster in doSNOW ; Compute the number of core available from the computer less 1
#      cl = makeCluster(clusterN, rscript="Rscript.exe", type='SOCK')  ###Cluster for doSNOW
core <- detectCores()-1#Compute the number of core available from the computer less 1
registerDoMC(core)#registerDoSNOW(cl) ###for Windows

master_list <- NULL
z <- NULL

NA_list_result <- foreach(z = names(plot_NA_list),.packages = c("spatstat","spptest","marksummary"),.multicombine = TRUE, .final = function(z) setNames(z, names(plot_NA_list))) %dopar% {
    plot_NA_list <- plot_NA_list[[z]]

    ppp_envelope_NA <- envelope(plot_NA_list, fun = "Lest",nsim = 30,correction="translate",savefuns = TRUE,simulate = expression(runifpoint( plot_NA_list$n, win= plot_NA_list$window))) #need to change the simulation to 2499 and to add at the end 'simulate=expression(runifpoint(plot_one_specie$n, win=plot_one_specie$window))'
    ppp_curve_set_NA <- envelope_to_curve_set(ppp_envelope_NA) #change the envelope class in a curve_set class. Need to add the use_theo argument
    ppp_curve_set_NA$theo <-  ppp_curve_set_NA$r
    res_NA <- residual(ppp_curve_set_NA,use_theo = TRUE)
    rank_NA <- rank_envelope(res_NA,lexo = FALSE,savedevs = TRUE) #use to plot and to have result

    master_list <- list(rank_env_NA = rank_NA,random_labelling = res_NA) #,residual_NA=res_NA
    return(master_list)
}  #stopCluster(cl)
###End of parallelisation for Windows and Linux
It will took some time to compute every 100 spatial patterns.
Then you should have this list of result:
NA_list_result[1:2]$`1` $`1`$rank_env_NA Rank envelope test p-value of the test: 0.3225806 (ties method: midrank) p-interval : (0.03225806, 0.6129032) $`1`$random_labelling curve_set object containing : List of 4 $ r : num [1:513] 0 0.000488 0.000977 0.001465 0.001953 ... $ obs : num [1:513] 0 -0.000488 -0.000977 -0.001465 -0.001953 ... $ sim_m : num [1:513, 1:30] 0 -0.000488 -0.000977 -0.001465 -0.001953 ... ..- attr(*, "dimnames")=List of 2 .. ..$ : chr [1:513] "1" "2" "3" "4" ... .. ..$ : chr [1:30] "sim1" "sim2" "sim3" "sim4" ... $ is_residual: logi TRUE - attr(*, "class")= chr "curve_set" $`2` $`2`$rank_env_NA Rank envelope test p-value of the test: 0.8709677 (ties method: midrank) p-interval : (0.8064516, 0.9354839) $`2`$random_labelling curve_set object containing : List of 4 $ r : num [1:513] 0 0.000488 0.000977 0.001465 0.001953 ... $ obs : num [1:513] 0 -0.000488 -0.000977 -0.001465 -0.001953 ... $ sim_m : num [1:513, 1:30] 0 -0.000488 -0.000977 -0.001465 -0.001953 ... ..- attr(*, "dimnames")=List of 2 .. ..$ : chr [1:513] "1" "2" "3" "4" ... .. ..$ : chr [1:30] "sim1" "sim2" "sim3" "sim4" ... $ is_residual: logi TRUE - attr(*, "class")= chr "curve_set"
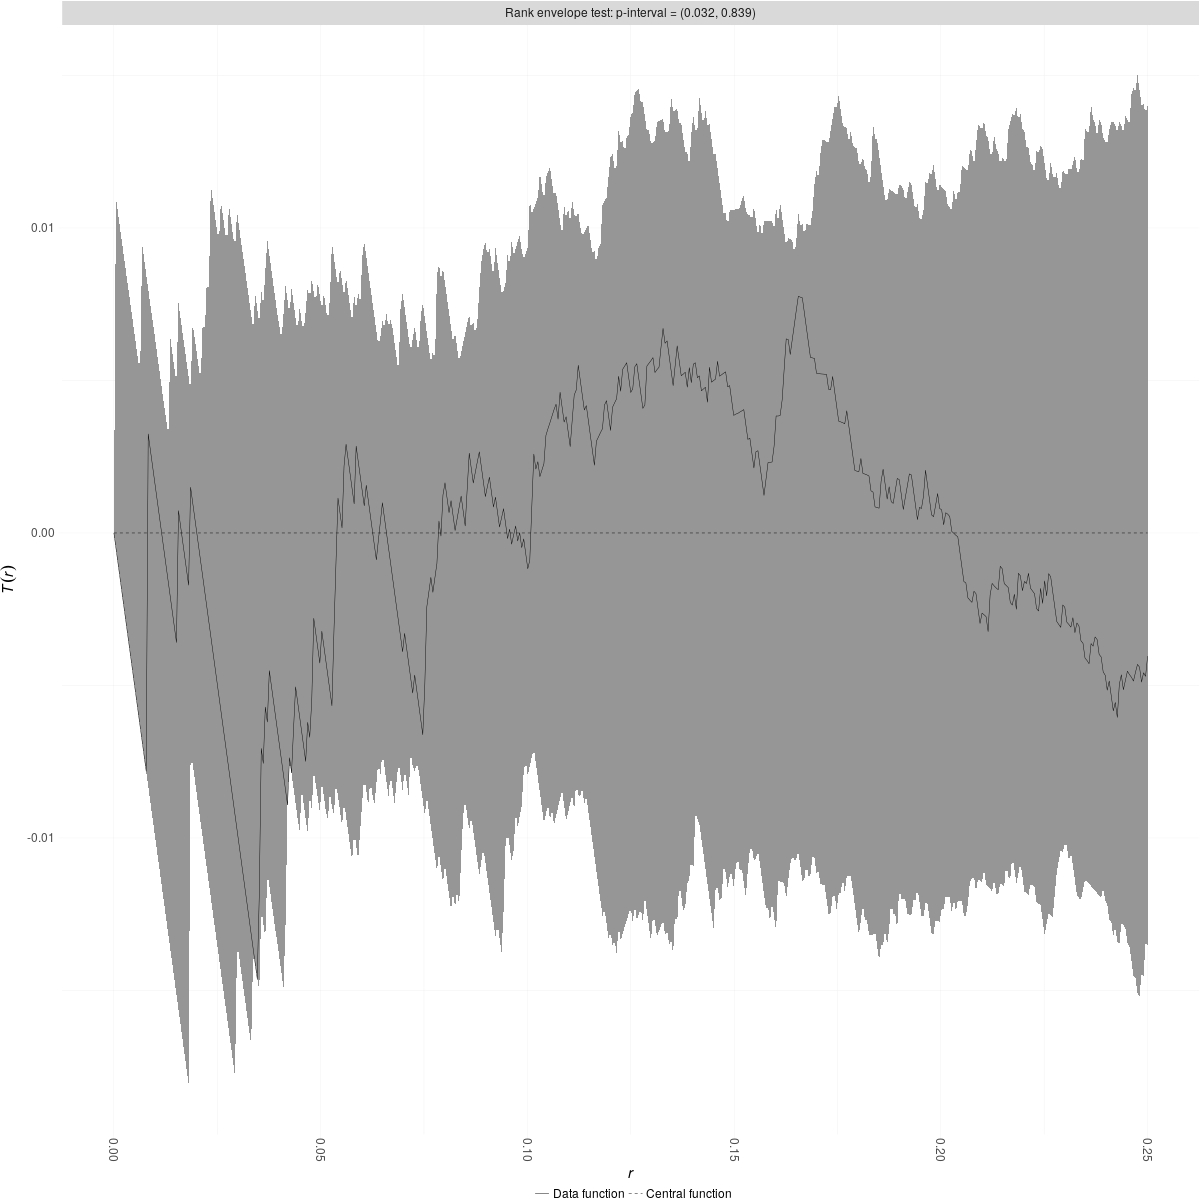
You can now plot the results from the rank envelope test:
library(ggplot2)
jpeg("rank_envelope.jpg",width = 1200, height = 1200, units = "px",quality = 100)
plot(NA_list_result$"1"$rank_env_NA,use_ggplot2=TRUE)
dev.off()
